Crowley
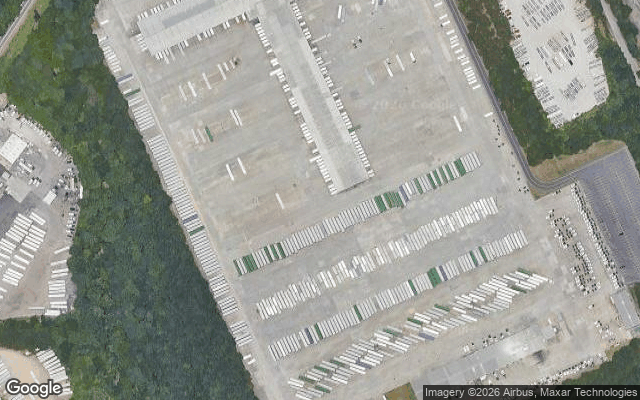
14 of ~270 facilities (US scope)333 dock doors6,920 trailer spots9 rail-served
Public audit. Not affiliated with Crowley. Data from satellite imagery + public records.
We audited every yard in Crowley’s network, from satellite.
Click any site for its gate, docks, and drop yards. No badge, no NDA, just what a driver sees.
Crowley’s stack is connected. The yards never were.
Your TMS runs the road. Your WMS runs the building. The yards are the tier between them, and they were never on the network.
Every truck gets re-keyed, re-queued, and re-found at each step. The lost time lives between the steps, which is why no single tool ever fixed it. The audit below is that gap, measured on your real yards.
A real audited site, played gate→dock→exit on the true yard geometry. Switch sites with the picker.
Crowley JAXPORT Marine Terminal - Jacksonville FL
Truck queues at the gate. Guard checks paper BOL, runs the plate, types data into a screen, prints a gate pass.
Movement durations are honest floors set by yard geometry; the uplift lands on the wait fields (queue + dispatch + secondary checkpoints). “Today” timings reflect the radios-and-clipboards world; “With YardFlow” reflects the protocol acting end-to-end. We may be wrong about parts of this — your actual numbers will tell us where.
What the handoffs cost across your network — and what removing them is worth
- Modeled annual value
- $259.6M/yr
- Modeled payback
- 3.9 mo
- Facilities modeled
- 270
Read from satellite + Street View across all 14 facilities, modeled on the same engine the full calculator opens on. At a comparable network, Primo Brands cut drop-and-hook turns from ~48 to ~24 min. Set your real volumes and margins in the calculator to make it yours.
Are these your yards?
Tell us where we got it wrong, or see what 15 minutes of orchestration looks like on your worst site.